Chart STL Syntax
This document describes a syntax of business graphics and associated data structures used in STL markup.
Users can use stl:chart element for creating an instance of page or
inline chart.
Following chart specific attributes are supported:
modern… defines what charting library is used.- “false” - use StreamServe library (default)
- “true” - creates svg charts using NVD3 javascript library. Some settings are limited
xpath… defines xpath to data where a part of chart definition that overrides chart definition defined under stl:chart is placed (available for scd and only for modern = “false” since 16.4) . Data related elements and attributes (scd:layer/@xpath,scd:series) cannot be modified this way. (See Chart definition in data)
 <stl:chart w="311.81pt" h="99.54pt" modern="false">
   <scd:scd xmlns:scd="http://developer.opentext.com/schemas/storyteller/chart/definition" style="font-family:Arial;font-size: 7pt;">
      <scd:plot left_offset="28.35pt" right_offset="14.17pt" top_offset="14.17pt" bottom_offset="28.35pt" logical_x_low="0" logical_x_high="100" logical_y_low="0" logical_y_high="1000"/>
      <scd:axis_x logical_position_x ="0" logical_position_y ="0" draw_behind="true"/>
      <scd:axis_y label="kWh" label_alignment="left" label_position_v="top" label_placement="end" logical_position_x ="0" logical_position_y ="0" draw_behind="true"/>
      <scd:support_lines logical_position_x ="0" logical_position_y ="0" logical_step ="100" label_placement="start" label_position_v="center" label_alignment="left" logical_width="2" draw_behind="true" mask="num.integer{}" style="font-family:Arial;font-size: 7pt;stroke-width: 0.57pt"/>
      <scd:layer type="line" xpath="//tabledata[@id='table1']" labels_offset="5" node_type="dot" node_size="2" line="stroke:rgba(0,0,0,1);stroke-width: 0.57pt;">
	    <scd:series y_column="1" x_column="2" label_column="3"/>
      </scd:layer>
   </scd:scd>
</stl:chart>
Chart definition
Docbuilder definition of chart begins with scd:scd. In future user would use different chart definitions
scd:scd
style… default chart styleclass… style class (limited when used for svg charts)
Chart parts
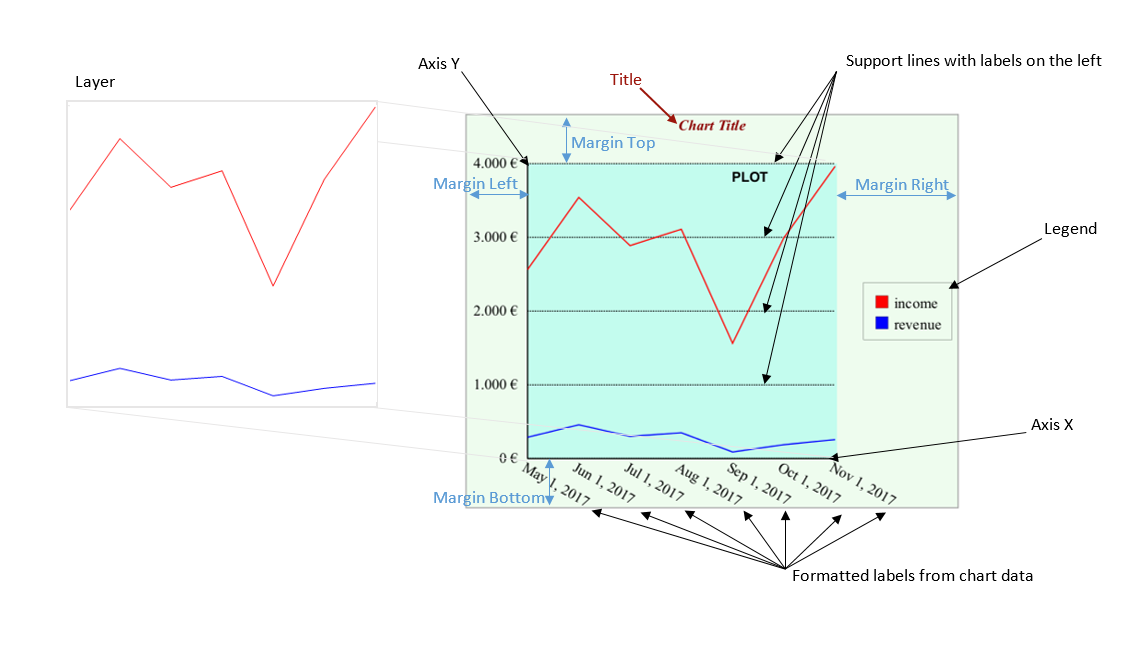
Users can specify the chart parts elements:
scd:title… title of chartscd:legend… legend of chartscd:plot… position, size and low/high logical coordinates for chart drawingscd:axis_x… axis x, more than one x axis can be defined (limited when used for svg charts)scd:axis_y… axis y, more than one x axis can be defined (limited when used for svg charts)scd:support_lines… support lines to allow better view of chart values (limited when used for svg charts)scd:layer… chart layer defines chart type and its parameters. The layer is drawn to the chart plot. More than one layer can be defined. Order of layers defines z-order.
scd:title
Users can specify following attributes
text… text of titleposition… title position (top/bottom)style… style of titleclass… style class (limited when used for svg charts)
scd:legend
Users can specify following attributes
alignment_v… legend vertical alignment (top/center/bottom)alignment_h… legend horizontal alignment (left/center/right)style… style of legend text and border lineclass… style class (limited when used for svg charts)
scd:plot
Users can specify following attributes
style… accepts margin-left/margin-right/margin-top/margin-bottom to define offsets of chart drawing from the chart border (in points)logical_x_low… logical low x valuelogical_x_high… logical high x valuelogical_y_low… logical low y valuelogical_y_high… logical high y value
scd:axis_x, scd:axis_y
Users can specify following attributes
style… style of legend text and border lineclass… style class (limited when used for svg charts)label… axis labellabel_alignment… label alignment (left/center/right)label_position_v… label vertical position (top/center/bottom)label_placement… label placement (start/end)logical_position_x… logical x value, where the axis is positioned tological_position_y… logical y value, where the axis is positioned tological_x_low… logical low x valuelogical_x_high… logical high x valuelogical_y_low… logical low y valuelogical_y_high… logical high y valuedraw_behind… axis should be drawn behind the chart
axis_x specific:
logical_width… logical width of x axis linelabel_rotation… data labels rotation in degreesdata_labels_position_h… data labels default horizontal position (alignment) (left/center/right)data_labels_position_v… data labels default vertical position (top/center/bottom)
axis_y specific:
logical_height… logical height of y axis line
If no attribute is specified the axis x/y is created with default settings.
scd:support_lines
Users can specify following attributes
label_alignment… label alignment (left/center/right)label_position_v… label vertical position (top/center/bottom)-
label_placement… label placement (start/end) logical_position_x… logical x value, where the lines start is positioned tological_position_y… logical y value, where the lines start is positioned tological_width… logical width of lines-
logical_step… step between lines in logical coordinates logical_x_low… logical low x valuelogical_x_high… logical high x valuelogical_y_low… logical low y value-
logical_y_high… logical high y value draw_behind… axis should be drawn behind the chartmask… format mask of valuesstyle… style of labels and lines
If no attribute is specified the support lines are created with default settings.
scd:layer
Users can specify following attributes
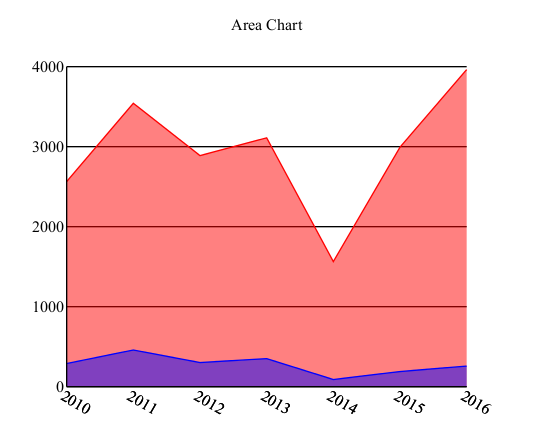
type… type of chart (line/bar/pie/stackedLine*/stackedArea*), modern types includes also (stackedAreaChart, multiBarHorizontalChart)xpath… xpath to data for chartlabels_offset… offset of labels from axis in pointslabels_line… style of lines connection to labels (for 16.2 just for bar/line charts)line… default style of lines around chart segments (for 16.2 just for pie chart)mask_label* … format mask of data labels-
mask_legend* … format mask of legend labels* since 16.3 update 1
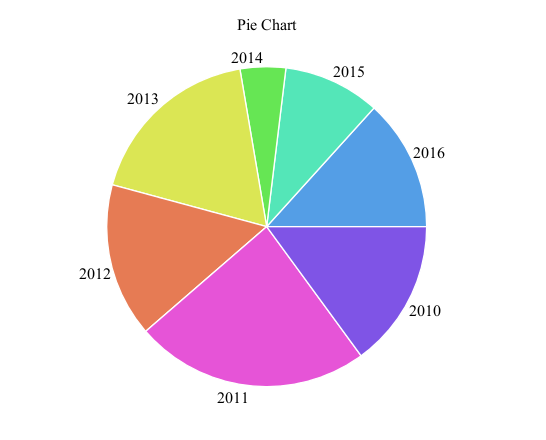
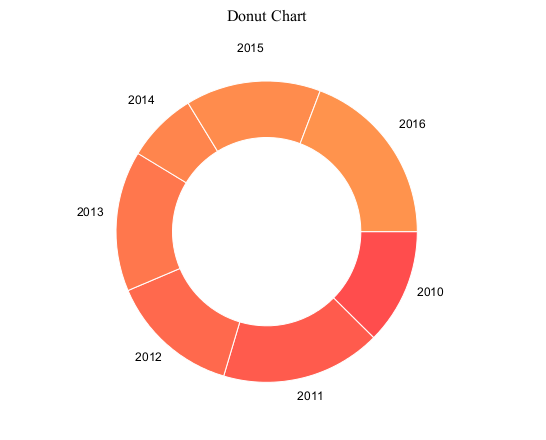
Attributes for a pie chart
line… style of lines in a pie chartradius… radius of a pie chart in logical coord.center_x… logical coord. x of centercenter_y… logical coord. y of centerstart_angle… start angle in degreesclockwise… true for clockwise pie slices placementheight3d… height of 3D chart in logical coord.xyratio… inclination of of chart (0..1)donut_ratio… ratio of radius for donut hole (0..1), 0 means no hole, 1 - hole has the same radius as pie chartline… style of lines in a pie chartlabels_connection… type of connection between labels and a pie chart (none/normal/level/radial/underlined/aligned)
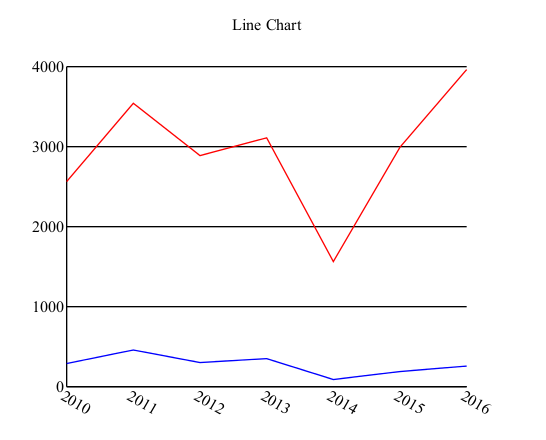
Attributes for a line chart
node_type… type of data values nodes (none/dot/square)node_size… data values nodes size (radius for dot or half of square width)connected_axis_x… index (from 1) of axis x used for showing labels and getting logical coordinatesconnected_axis_y… index (from 1) of axis y used for showing labels and getting logical coordinatesarea… “true” for area color from data or directly fill color of area under line
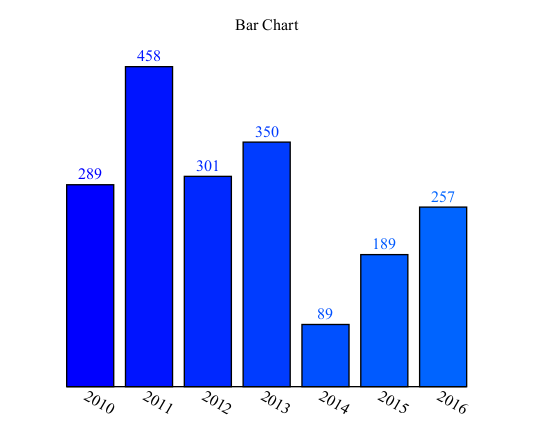
Attributes for a bar chart
offset_left… left offset of the first bar (in logical coordinates)offset_right… right offset of the first bar (in logical coordinates)bar_width… width of bars (in logical coordinates)gap… gap between bars (in logical coordinates)rx*… x radius of bar chart rounded cornersry*… y radius of bar chart rounded cornersconnected_axis_x… index (from 1) of axis x used for showing labels and getting logical coordinates-
connected_axis_y… index (from 1) of axis y used for showing labels and getting logical coordinates* since 16.3 update 1
Subelement scd:series for data definition
Attributes:
col_x- index of column (started from 1) in data table for x valuescol_y- index of column (started from 1) in data table for y valuescol_label- index of column (started from 1) in data table for labelscol_legend- index of column (started from 1) in data table for legend
Dynamic definition in script
Selected scd elements can be modified using stl:script :
Title - chart title
Direction - chart texts direction (‘None’, ‘L2R’, ‘R2L’)
BidiAndShaping - chart texts bidi and shaping (‘chars’, ‘forms’, ‘glyphs’)
Plot
LogicalXLow … logical low x value
LogicalXHigh … logical high x value
LogicalYLow … logical low y value
LogicalYHigh … logical high y value
MarginLeft … left margin in points
MarginRight … right margin in points
MarginTop … top margin in points
MarginBottom … bottom margin in points
var plot = require('layout').item().Plot;
plot.LogicalYHigh = 5000;
AxesX - array of X axes (zero based index)
AxesY - array of Y axes (zero based index)
LogicalPositionX … logical x value, where the axis is positioned to
LogicalPositionY … logical y value, where the axis is positioned to
LogicalXLow … logical low x value
LogicalXHigh … logical high x value
LogicalYLow … logical low y value
LogicalYHigh … logical high y value
LogicalWidth … logical width (length) of x axis line
LogicalHeight … logical height (length) of y axis line
var axis_x = require('layout').item().AxesX[0];
axis_x.LogicalPositionY = -2000;

var axis_y = require('layout').item().AxesY[0];
axis_y.LogicalHeight = 2000;
SupportLines - array (zero based index) of support lines definitions
LogicalPositionX … logical x value, where the axis is positioned to
LogicalPositionY … logical y value, where the axis is positioned to
LogicalXLow … logical low x value
LogicalXHigh … logical high x value
LogicalYLow … logical low y value
LogicalYHigh … logical high y value
LogicalWidth … logical width (length) of x axis line
LogicalStep … step between lines in logical coordinates
var support_lines = require('layout').item().SupportLines;
var support_line = support_lines[0];
support_line.LogicalStep = 1000;
Chart definition in data (since 16.4)
The scd:scd structure can be defined in data. This way can be defined values with data transformation. The scd definition from data overrides definition from document. Axes, support lines or layers overrides the ones in the same order or adds new ones. Chart definition in data cannot override layer/xpath attribute and series.
<chartdata id="table1">
	<scd:scd xmlns:scd="http://developer.opentext.com/schemas/storyteller/chart/definition">
		<scd:title text="Bar Chart"/>
      	<scd:plot logical_y_high="2000"/>
		<scd:axis_x label="year"/>
		<scd:layer type="bar"/>
	</scd:scd>
</chartdata>
....
<stl:p class="paragraph">
	<stl:chart id="bar" w="400pt" h="320pt" xpath="//chartdata/scd:scd">
		<scd:scd>
			<scd:title text="Title in definition" style="font-size:20pt;font-style:italic"/>
			<scd:legend style="font-size:10pt;font-style:italic"/>
			<scd:axis_x label_alignment="right" label_position_v="center" label_placement="end" label="X" style="font-size:10pt;font-style:italic;stroke:rgb(255,0,0);stroke-width:3pt"/>
			<scd:layer xpath="//chartdata">
				<scd:series col_label="1" col_y="3"/>
			</scd:layer>
		</scd:scd>
	</stl:chart>
</stl:p>
Chart data
Data structure must be defined to use charts.
 <tabledata id="table1" default_style="font-family:Arial">
    <ddi:header>
       <ddi:cell data_type="number" data_style="fill:#ff0000;stroke:#ff0000">Value</ddi:cell>
       <ddi:cell data_type="number">X</ddi:cell>
       <ddi:cell>Description</ddi:cell>
    </ddi:header>
    <ddi:row>
       <ddi:cell data_style="fill:rgb(212,113,28); stroke:rgb(212,113,28); stroke-width:1.42;stroke-dasharray:1, 2">0</ddi:cell>
       <ddi:cell>7.6</ddi:cell>
       <ddi:cell label_rotation="45" label_position_h="center" data_style="font-size: 7pt;">jan-12</ddi:cell>
    </ddi:row>
</tabledata>
Main element of chart data can have default_style attribute that defines default text style for data labels.
Predefined elements use ddi namespace defined already for rigid data of interactive items: xmlns:ddi=”http://developer.opentext.com/schemas/storyteller/layout/ddi/v1”.
Elements:
ddi:header
Users defines column headers for data columns.
ddi:cell
Attributes:
data_type… type of data (e.t. number) in the column. If not defined, string type is taken as defaultdata_style… style for the whole series
ddi:row
Users defines rows of data
ddi:cell
Attributes:
data_style… style used for the chart elements and their labelsexploded… part of pie chart that should be exploded (burst) (true/false)label_rotation… rotation of label in degreeslabel_position_h… horizontal position of label (left/center/right), default is center if not specified as axis_x attributelabel_position_v… vertical position of label (top/center/bottom), default is bottom if not specified as axis_x attribute
Chart examples:
Modern chart that uses javascript NVD3 library and SVG rendering:
 Try in STLEditor »